오픈소스 컨테이너 모니터링 툴 Prometheus(2) : 설치편
안녕하세요.
저번 포스팅에서는 오픈소스 컨테이너 모니터링 툴 Prometheus(1) : 이론 편[1]에 대해 설명드렸습니다. 이번 포스팅에서는 이론 편에 이어 설치 편을 말씀드리겠습니다. 사실 Prometheus는 다른 모니터링 프로젝트에 비해 구성이 간편하고 쉽습니다.
따라서 이번은 Prometheus를 설치하고, exporter를 구성한 뒤 Grafana와의 연동까지 진행해보도록 하겠습니다. Grafana는 Prometheus와의 연동을 통해 컨테이너 모니터링의 시각적 기능을 지원할 수 있습니다.
해당 포스팅은 Prometheus의 공식 사이트의 설치 방법을 참조합니다. [2]
Prometheus 설치
Prometheus 설치 과정은 크게 코드를 받고, 설정 파일을 수정하고 Prometheus를 실행하는 것입니다. 그럼 먼저 아래의 명령을 통해 Prometheus 사이트로부터 최신 버전의 Prometheus를 다운로드합니다.
root@k8s-master:~# wget https://github.com/prometheus/prometheus/releases/download/v2.13.1/prometheus-2.13.1.linux-amd64.tar.gz
공식 사이트의 설치 페이지에 가시면 Download section이 있습니다. 여기서 linux 버전의 tar 파일에 오른쪽 마우스를 누르신 뒤 링크 주소 복사를 하시면 쉽게 주소를 복사하실 수 있습니다. 이제 파일을 모두 다운로드하였다면, 다음의 명령을 통해 압축을 풀도록 하겠습니다.
root@k8s-master:~# tar -xvf prometheus-2.13.1.linux-amd64.tar.gz
root@k8s-master:~# cd prometheus-2.13.1.linux-amd64/
tar 명령을 통해 압축을 푸신 뒤 해당 폴더로 이동해주시면 됩니다. 이동한 다음 vi 명령어를 통해 prometheus.yml을 열어주시면 됩니다.
# my global config
global:
  scrape_interval:     15s
  evaluation_interval: 15s
  # scrape_timeout is set to the global default (10s).

# Alertmanager configuration
alerting:
  alertmanagers:
  - static_configs:
    - targets:
      # - alertmanager:9093

# Load rules once and periodically evaluate them according to the global 'evaluation_interval'.
rule_files:
  # - "first_rules.yml"
  # - "second_rules.yml"

# A scrape configuration containing exactly one endpoint to scrape:
# Here it's Prometheus itself.
scrape_configs:
  # The job name is added as a label `job=<job_name>` to any timeseries scraped from this config.
  - job_name: 'prometheus'

    # metrics_path defaults to '/metrics'
    # scheme defaults to 'http'.

    static_configs:
    - targets: ['localhost:9090']
promethues.yml의 기본 구성은 간단하지만 prometheus configuration docs [3]는 상당히 복잡합니다. 우선은 기본 구성을 가지고 진행한 뒤, 추후 응용 수준의 포스팅을 진행하겠습니다. 우선 기본적인 yml 파일의 옵션은 다음과 같습니다.
- global.scrape_interval : 모니터링 대상에게 데이터를 가져오는 주기
- evaluation_interval : 데이터 요청 후 회신까지 기다리는 주기로 해당 주기를 기준으로 알람 여부 결정 가능
- alerting.alertmanagers.static_config.targets.alertmanager : 별도로 구동 중인 Alertmanager 프로세스 port 지정
- rule_files : Rule 파일의 경로 지정( 여러 개 지정 가능)
- scrape_configs.job_name : 수집한 Metric에 대한 이름 지정
- scrape_configs.static_configs.targets : 모니터링 대상의 IP:PORT 지정
그럼 yml 파일의 별다른 수정 없이 아래의 명령을 이용해 Prometheus를 이용한 모니터링을 진행해보도록 하겠습니다.
root@k8s-master:~/prometheus-2.13.1.linux-amd64# ./prometheus --config.file = prometheus.yml
그다음 Prometheus가 제공하는 웹 UI에 접속하기 위해 웹 브라우저에서 http://[Prometheus IP]:9090을 입력해 줍니다.

그림 1에서는 Prometheus 기본 UI를 나타냅니다. 기본적인 그래프, 메트릭 선택, 메트릭 필터링을 위한 쿼리문 등기본적인 것은 간단하게 확인할 수 있습니다. 그럼 Prometheus Exporter와 cAdvisor를 통한 메트릭 수집에 앞서서 먼저 Prometheus와 Grafana를 연동하여 다양하게 메트릭 데이터를 시각화하겠습니다.
Grafana 설치 방법 또한 매우 간단합니다. 설치법은 grafana 공식 사이트의 인스톨 페이지[4]를 참조하였습니다.
root@k8s-master:~# wget https://dl.grafana.com/oss/release/grafana_6.4.3_amd64.deb
root@k8s-master:~# dpkg -i grafana_6.4.3_amd64.deb
위에 명령은 grafana를 다운로드하고, 패키지 매니저로 grafana를 설치합니다. 아주 간단하게 설치가 완료되고 웹 브라우저에서 [Grafana IP:3000](기본)을 치면 그림 2와 같은 UI가 나타납니다. 초기 비밀번호는 admin/admin입니다.

로그인을 하시게 되면, 이제 Prometheus와의 연동을 위해 좌측 패널의 톱니바퀴(Configuration)에서 Data Sources를 선택해야 합니다. Add data source를 누르시면 바로 Prometheus가 보이는데 Grafana가 업데이트됨에 따라 Prometheus는 기본 data source로 들어가게 되었습니다. Prometheus를 눌러주시고, 그림 3과 같이 HTTP-URL에 Prometheus의 IP와 PORT를 작성해주시면 됩니다.

Data source is working이라는 문구가 하단에 뜨게 되면 성공적으로 연동된 것입니다. 이때 중요한 것은 Prometheus 서버는 동작하고 있어야 합니다.
Prometheus Exporter & cAdvisor
지금부터는 Prometheus의 Exporter 즉 모니터링 에이전트와 Kubernetes의 cAdvisor를 연동하여 모니터링을 진행해 보도록 하겠습니다. Exporter와 cAdvisor에 대해서는 1편에서 소개드렸기 때문에 지금은 간단한 설치와 연동 방법에 대해서만 설명드리겠습니다.
root@k8s-master:~# wget https://github.com/prometheus/node_exporter/releases/download/v0.18.1/node_exporter-0.18.1.linux-amd64.tar.gz
root@k8s-master:~# tar -xvf node_exporter-0.18.1.linux-amd64.tar.gz
root@k8s-master:~# cd node_exporter-0.18.1.linux-amd64
root@k8s-master:~/node_exporter-0.18.1.linux-amd64# ./node_exporter
먼저 wget 명령어를 이용하여 node exporter를 받아줍니다. 그다음 tar 명령을 통해 압축을 풀고 node_exporter를 실행시켜줍니다. 기본적으로 node_exporter의 포트번호는 9100입니다.
# my global config
global:
  scrape_interval:     15s # Set the scrape interval to every 15 seconds. Default is every 1 minute.
  evaluation_interval: 15s # Evaluate rules every 15 seconds. The default is every 1 minute.
  # scrape_timeout is set to the global default (10s).

# Alertmanager configuration
alerting:
  alertmanagers:
  - static_configs:
    - targets:
      # - alertmanager:9093

# Load rules once and periodically evaluate them according to the global 'evaluation_interval'.
rule_files:
  # - "first_rules.yml"
  # - "second_rules.yml"

# A scrape configuration containing exactly one endpoint to scrape:
# Here it's Prometheus itself.
scrape_configs:
  # The job name is added as a label `job=<job_name>` to any timeseries scraped from this config.
  - job_name: 'prometheus'
    static_configs:
    - targets: ['localhost:9090']

  - job_name: 'Node_exporter'
    static_configs:
    - targets: ['localhost:9100']
다음 Prometheus에서 yml 파일을 수정해 주는데 맨 아래 하단에 job을 추가시켜줍니다. job 이름은 Node_exporter로 작성하였고 targets은 node_export가 설치된 IP주소와 기본 포트인 9100을 작성하여 Prometheus가 Node_exporter로부터 데이터를 수집할 수 있도록 합니다. 그다음 Prometheus를 실행시켜줍니다.
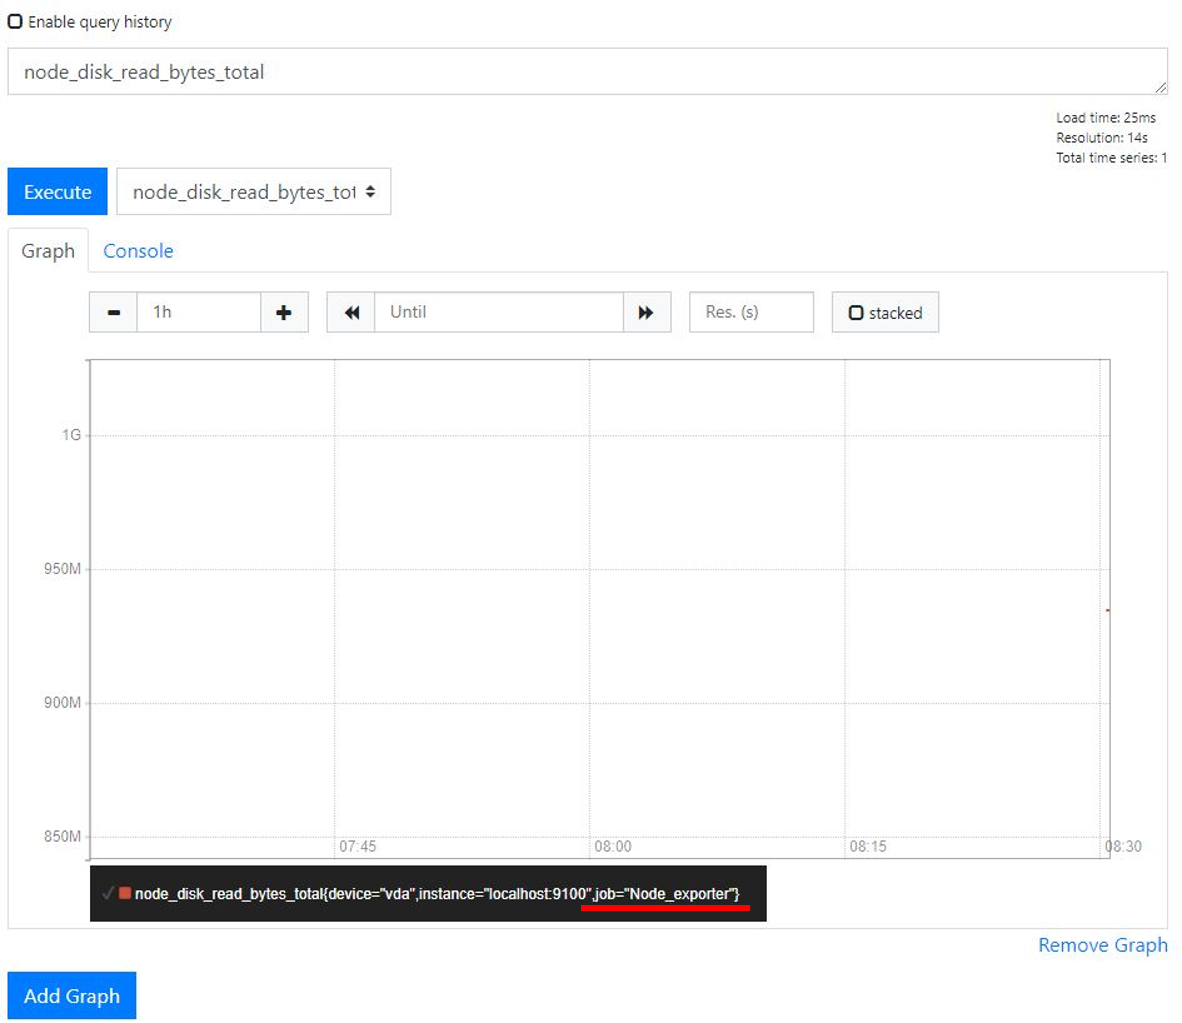
그림 4에서는 Node_exporter 연동 확인을 나타내는데, node_dist_read_bytes_total과 같은 메트릭을 선택하게 되면 하단에 Job 이름이 Node_exporter인 것을 확인하실 수 있으며, 정상적으로 연결된 것을 확인할 수 있습니다.
다음은 cAdvisor와 Prometheus를 연결하여 모니터링하도록 하겠습니다. cAdvisor는 간단하게 아래와 같이 docker 명령을 이용하여 실행할 수 있습니다. 주의하실 점은 8080:8080 포트를 연결해주는 명령인데 왼쪽 8080은 원하는 포트번호(외부 접근용) 우측 8080 내부 포트 번호를 작성해주시면 됩니다. 해당 명령은 cAdvisor 설치를 검색하시면 일반적으로 나오는 명령입니다.
root@k8s-master:~# docker run \
  --volume=/:/rootfs:ro \
  --volume=/var/run:/var/run:rw \
  --volume=/sys:/sys:ro \
  --volume=/var/lib/docker/:/var/lib/docker:ro \
  --volume=/dev/disk/:/dev/disk:ro \
  --publish=8080:8080 \
  --detach=true \
  --name=cadvisor \
  google/cadvisor:latest
마찬가지로 cAdvisor의 IP:PORT(docker 명령에서 입력한 왼쪽 포트 정보)를 Prometheus의 yml 파일에 작성해줍니다. 해당 예제에서는 job_name에 cAdvisor를 작성하였고 port는 8080을 작성하였습니다.
# my global config
global:
  scrape_interval:     15s # Set the scrape interval to every 15 seconds. Default is every 1 minute.
  evaluation_interval: 15s # Evaluate rules every 15 seconds. The default is every 1 minute.
  # scrape_timeout is set to the global default (10s).

# Alertmanager configuration
alerting:
  alertmanagers:
  - static_configs:
    - targets:
      # - alertmanager:9093

# Load rules once and periodically evaluate them according to the global 'evaluation_interval'.
rule_files:
  # - "first_rules.yml"
  # - "second_rules.yml"

# A scrape configuration containing exactly one endpoint to scrape:
# Here it's Prometheus itself.
scrape_configs:
  # The job name is added as a label `job=<job_name>` to any timeseries scraped from this config.
  - job_name: 'prometheus'
    static_configs:
    - targets: ['localhost:9090']

  - job_name: 'cAdvisor'
    static_configs:
    - targets: ['localhost:8080']
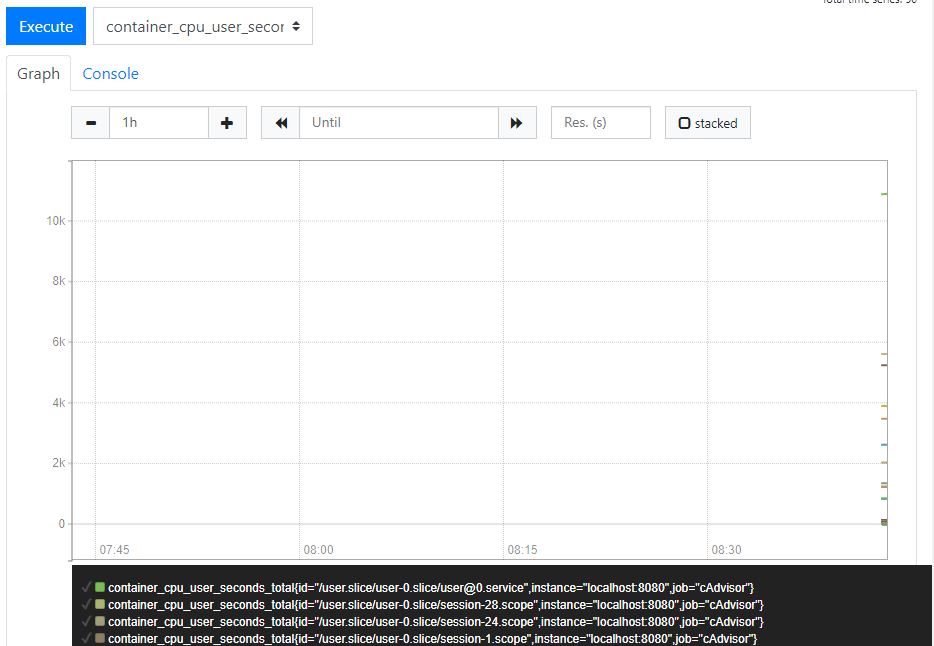
Prometheus를 실행하게 되면 아래와 같이 job이름이 cAdvisor인 매트릭을 정상적으로 수집하는 것을 확인할 수 있습니다.
결론
이번 포스팅에서는 간단하게 Prometheus에 대해 설치하였고, 여러 모니터리 에이전트들과 연동해보았습니다.
Prometheus는 설치가 쉽고 Container 모니터링 툴로써 많이 사용 중이므로 충분히 연구해볼 만한 프로젝트입니다.
혹 부족한 내용이 있다면 말씀 주시면 즉시 반영하겠습니다.
감사합니다.
인용글
[1] 오픈소스 컨테이너 모니터링 툴 Prometheus(1) : 이론편: https://delightwook.tistory.com/27?category=766954
[2] prometheus install : https://prometheus.io/docs/prometheus/latest/installation/
[3] prometheus configuaration : https://prometheus.io/docs/prometheus/latest/configuration/configuration/
[4] grafana install : https://grafana.com/grafana/download
업데이트로그
--------------------------------------------------------------------------------------------------
해당 글은 스스로 연구한 내용을 통한 주관적인 이해를 바탕으로 작성 되었습니다. 수정 할 부분이 있거나, 다른 의견이 있으시다면 언제든지 말씀해주시면 반영하도록 하겠습니다. 읽어 주셔서 감사합니다. 끝으로 불법으로 복제하는 것은 금합니다.